
LMT Forex Formula In Action
Oops. I had in mind to post a screenshot of the LMT Forex Formula in action in my previous post (below this one) but forgot at the last minute before I published the blog posting. Anyways, I decided to start a new post rather than lengthen the previous one which was only intended to be a sort of “announcement” post.
Here is how the system works when it’s all setup and running:

What you see in that image are 3 main indicators and an expert advisor (EA). The first indicator is a overall trend indicator (green arrow), then the second one is what Dean Saunders calls a trigger indicator, and the last indicator is a 10 period EMA (exponential moving average). The expert advisor you can see at the top right corner of the chart. Its job is to monitor the market for a proper entry point based on the rules of this trading system.
So essentially this LMT Forex Formula is a “semi-automatic” trading system. The expert advisor will alert you of a possible entry. Your job then is to confirm this entry by following a few simple steps which you’ll find in the PDF manual.
I am thinking that maybe this system can be fully automated - i.e turned into an expert advisor. I’ll get in touch with my coder and see what we can do. If I succeed in turning this into an EA I will be able to conduct a backtest and see how this system performed in the past 4-5 years. Of course I will publish my results as usual, so stay tuned to this blog (or better yet subscribe to the RSS feed.)
Ok, that about does it for this post. I’ll be back with some performance results as soon I can gather them.
Other useful resources:
To chat with other owners of this trading system I invite you to checkout this thread on my Forex Nirvana forum:
http://www.forexnirvana.com/showthread.php?t=676
To get your own copy of the LMT Forex Formula visit its homepage here.
Cheers,
Alan
http://alansforexblog.com
I Got a Copy Of the LMT Forex Formula

Hello. Just a brief post to let you all know that I got a copy of Dean Saunders’s LMT Forex Formula two days ago, and that I will be putting this system to a long term performance test. So far I’ve had no signals but I’m sure eventually they will come.
I’m trading this system on the following pairs: EUR/USD (D1 and H4), GBP/USD (H4 and D1), USD/CHF, USD/JPY, EUR/JPY, GBP/JPY, AUD/USD, USD/CAD (all these on the daily time frame only)
I’ll be posting trading results as soon as I get them.
Oh, btw, here is a useful forum thread regarding LMT Forex Formula on the Forex Nirvana forum:
http://www.forexnirvana.com/showthread.php?t=676
Happy trading everyone.
Alan
Kim Jong Il is at it again as North Korea fires off more missiles!
While we had Memorial Day in the U.S., North Korea was firing off missiles and testing a nuke! Even as late as this morning, they were still firing off missiles.
They continue to defy U.N. warnings against such activity. So they will undoubtedly suffer sanctions from many countries of the world.
I’m sure what they hope for is the ability to sell weaponry to other evil governments that will help to offset the strain that the sanctions put on them.
Then, once again, they will probably do like before and “promise to be good boys” while they have their fingers crossed behind their backs.
You can’t “reason” with evil and therefore you can’t reason with Kim Jong Il.
He’s a confused puppy. He wears glasses that only Elton John could love…and wears his hair like Elvis! He tries to poof his hair up as much as he can to help to compensate for height.
So if Obama, the U.N. or any others think they can “truly” reason with him and bring about long term change, they are kidding themselves.
Therefore, expect for there to be surprises in the currency market here and there as they point missiles towards Japan and towards South Korea. Expect it to gyrate the yen and won from time to time.
However, ultimately, his effect upon currencies will be temporal and not long lasting…thankfully!
Stay tuned to this saga and see where it goes, because it could gyrate things in the mean time and money can be made off of something you or I can’t control…which are the actions of this “mad man”! Click on the pic to enlarge it. 
S&P Cuts British Outlook- GBP falls
S&P cut the UK debt outlook from stable to negative this morning, tanking the GBP. It fell to 1.5522, holding near-term support levels at 1.55. It has since bounced off of those levels and has retraced to its 61.8 fibonacci level on a 5-minute chart (see below) It looks to be range-bound as it is trading between the 38.2 and 61.8 levels. Look for a break to the upside if it can break through resistence of the 61.8 level around 1.57. Support is at 1.5625, near the 38.2 level. Look for lower prices should that level be breached.
(Click on the image to enlarge it)

Are US Treasuries to be Tax deductable?
Make US Treasuries tax deductable? A tax advantage might be a nice incentive to get the public involved and take up some of this record supply. This question was posed to Bill Gross from PIMCO yesterday. Was this an innovative thought? Was the interviewer being fed a question by a higher authority? What ever the reason it’s a unique idea never the less that solve the demand concerns!
Here are 5-quick reasons ‘not’ to own the USD this morning:
- The BRIC countries will discuss the ‘dollar’s dominance’
- PIMCO is vocal about US ratings again.
- South Korea pension funds are looking to diversify away from it.
- The strength of commodities.
- ECB is openly concerned about the greenback. The demand for yesterday’s 7-year Treasury auction was less than impressive.
The US$ is weaker in the O/N trading session. Currently it is lower against 14 of the 16 most actively traded currencies in a ‘whippy’ trading range.

April’s US durable goods numbers surprised to the upside yesterday. The +1.9% print was the largest headline reading since Dec. 2007. However, it followed a revised -2.1% drop for Mar., which was more than double the previous estimate (-0.8%). The gains can be attributed to a surge in both auto demand and defense spending which outpaced again any investment in business equipment (analysts believe that this variable will be the last area of the US economy to gain traction as companies with record spare capacity will shy away from investing in new equipment until sales improve). Ex-transportation, the print advanced to +0.8% vs. -0.4% m/m.
Are the biggest rounds of firings over in the US? Last week we witnessed fewer Americans filing for unemployment claims. It was down on the week by -13k to +623k vs. the previous revised headline of +636k. Perhaps with the slowing of job-losses this may encourage the US consumer to loosen their grip on the purse strings? It is probably the most important variable in the equation to US recovery happening during the Fed’s timeline. The catch-22 of course is that companies will be disinclined to hire workers and increase production until sales growth is sustainable. Pessimists will tell you be weary of the range bound headlines, they expect claims to head even higher over the coming weeks once auto sector troubles fully work their way into the reporting data!
Other US data showed that the purchases of new homes rose for the 2nd time in 3-months yesterday supported by both lower prices and cheaper financing. Month-over-month, sales increased +0.3% to +352k vs. +351k, but lower than initial analysts estimates of +363k. The median sales price has fallen -15%, y/y, and the number of units on the market fell to its lowest level in nearly a decade. Not such good news was that the MBA (Mortgage Bankers Association) reported that delinquencies (seasonally adjusted +9.12%) and foreclosures (+1.37%) rose to new records in the 1stQ because of mounting job losses. No pay, no mortgages!
The USD$ currently is lower against the EUR +0.40%, GBP +0.66%, CHF +0.34% and JPY +0.47%. The commodity currencies are stronger this morning, CAD +0.76% and AUD +0.61%. The loonie continued its strengthening bias in the O/N session as commodities, especially crude touching a 7-month high, enticed investors to invest in higher-yielding assets. With the USD struggling, parity talk is back on the table. Some are buying into the theory that with Canada being a small, open economy and sensitive to trade flows, if and when the global economy is doing better then Canada is expected to reap the benefits very quickly. There is no disputing this theory, it’s expected over time that the loonie will trade at a premium to its southern neighbor, but, at such an early stage in the game, the move has been too aggressive and too quick. The month of May has been good for the higher yielding commodity currencies (AUD, NZD and CAD), while the USD is the worst performing currency. There is nothing fundamentally supporting the currency, even the Canadian finance minister this week said that the proposed national deficit will balloon to $50b from the $34b announced in Jan. The longer term fundamentals certainly support a much stronger CAD, however investors have plenty of time to add to their positions at more favorable levels.
The AUD is heading for monthly record advance across the board (+9.4%) as investor confidence is boosting the purchases of higher-yielding assets. Commodities account for 50% of the country’s total exports and the weekly price rise is the biggest witnessed in 35-years. The country’s fundamentals remain strong and with commodities nudging forward, one should expect buying on pull backs ((0.7956).
Crude is higher in the O/N session ($65.58 up +50c). For the 2nd time this year OPEC members left production quotas unchanged yesterday in Vienna and will rely on demand to increase by year-end. They are responsible for 40% of the worlds supply and agreed to keep production quotas at the 24.8b level. OPEC treads a fine line, the world has ample supply at the moment and the organization does not want to send out the wrong signal to struggling economies. To date members have only completed 77% of the previous cut implemented last Sept. A struggling greenback has also lent support to commodity prices. A day late reporting due to the Memorial holiday the weekly EIA inventories declined -5.41m barrels to +363.1m last week. It was an eye popping drop and the biggest in 9-months (hurricane season). Analysts were expecting a weekly decline of only -150k barrels. Technical analysts say that with oil rising above its 200-day moving average for the 1st- time in 8-months is a signal that prices will rally even further. If OPEC ever fully completes the cut-backs then perhaps the black stuff will manage to achieve their desired target of $75 year end. Some analysts believe that with record 19-year high inventory levels combined with the contraction in activity in advanced economies, the market should expect some sort of pull back from these levels. Of course the ‘dismal dollar’ will not aid their theory. A spluttering USD has given new life to the yellow metal. One should expect speculators and investors to want to own the commodity as a hedge for the greenbacks slide ($973).
The Nikkei closed 9,522 up +71. The DAX index in Europe was at 4,996 up +63; the FTSE (UK) currently is 4,442 up +55. The early call for the open of key US indices is higher. The 10-year Treasury eased 4bp yesterday (3.66%) and another 7bp in the O/N session (3.59%). Be aware of strong month-end demand today, there is a hefty month end index extension expected, coupled with a new round of Fed buy-backs announced yesterday could give the FI curve more of a bid!
A Year of Performance Tracking
It has been more than a year since I first started to measure my daytrading system performance on a monthly basis. Here a couple of charts I put together to see how I have been fairing:
These graphs tell me that I have been doing the right thing all year long by:
1) Generating the right trading ideas at the right time
2) Diversifying my money in two different market places, i.e. Major Pairs and Yen Crosses.
I am able to make steady gains with the two systems, simply by betting against the short-term moves for the US dollar and Japanese Yen day in day out. The combined results say it all. I have made more gains than losses, 10 positive months out of 14, averaging about 310 pips each month.
Worth mentioning, the only one time my system made a triple-digit losses was back in July 2008, that is -140 pips. Others are -50, -70 and -25 pips in May' 08, Nov' 08 and Jan' 09. Also on the plus side, the system is capable of hitting four-digit monthly gains, which so far outstrip the recorded losses by many times. This has already happened twice: +1175 pips in Aug' 08 and just recently +1055 pips in Feb' 09.
Overall, my system did incredibly well even when the market was volatile. I hope my system can continue to make gains for me and you as the economy recovers.
Here are my monthly daytrading reports:
March 2009 Trading Performance
February 2009 Trading Performance
November 2008 Trading Performance
October 2008 Trading Performance
September 2008 Trading Performance
August 2008 Trading Performance
July 2008 Trading Performance
June 2008 Trading Performance
May 2008 Trading Performance
April 2008 Trading Performance
March 2008 Trading Performance
February 2008 Trading Performance
The Theme Continues: Commodity dollars rising vs. the Buck!
Commodity currencies continue to gang up on the buck as the recession becomes shallower and commodities pick up as more global growth and demand starts to pick back up.
Also, investors are betting on inflation coming in the future and are positioning themselves ahead of time. To do that in currencies, there’s no better picks than these commodity currencies vs. the buck. It’s a “double whammy”.
The dollar gets pummeled when commodities and inflation rise while at the same time the Aussie, New Zealand and Canadian dollars get the “wind to their backs” when this happens.
So the AUD/USD and NZD/USD long and USD/CAD short get “blessed” doubly during these times like we’re experiencing now.
Recently, some of the moves that have taken my account to new highs have been plays on the Aussie dollar vs. the U.S. dollar and yen (being long AUD/USD and AUD/JPY).
Australia is one of the clear fundamental winners even amongst the commodity currencies. The trends have been clear and they’ve been strong.
Of course there will be pull backs along the way, and they could be volatile and violent. However, look for the uptrend to resume each time these huge pull backs happen.
Sean Hyman

Carry Trade Lifts Hungarian Forint
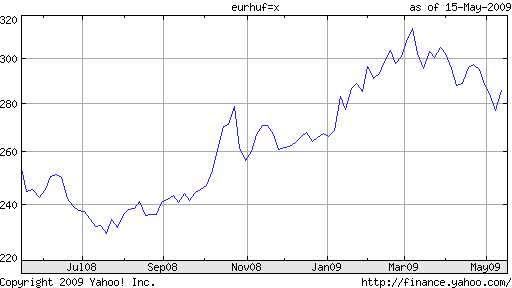
The rally in emerging markets and accompanying revival of the carry trade can be seen clearly in the Hungarian Forint, which can now claim the distinction of being the world’s best performing currency. You’re probably scratching your head and/or rolling your eyes, but bear with me.
Beginning last July, shortly before the peak of the credit crisis, the Forint began to fall rapidly. It quickly lost more than half of its value against the Dollar, but then again so did a bunch of other currencies. The more relevant comparison is with the Euro, against which the Hungarian currency also fared quite poorly. Despite a 13% rally over the last two months, the Forint is still down 27% from its high last summer.
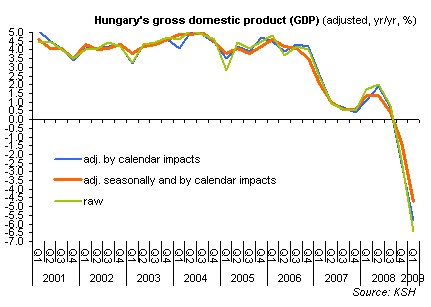
This is understandable, since Hungarian economic fundamenals are commensurately poor. “Household consumption is shrinking due to a drop in wages and narrower borrowing opportunities, while investments are hit by a lack of funds and a global economic downturn.” Factor in an 18.7% annualized decline in exports, and the result is a 6.4% decline in GDP for the most recent quarter.
Hungary’s economic woes have not gone unnoticed. “The International Monetary Fund, the EU and the World Bank have pledged 20 billion euros ($27 billion) of emergency loans to support Hungary, the biggest aid package for a European nation alongside Romania.” While financial markets have stabilized, credit default swap rates indicate investors are still concerned about the possibility of default. Meanwhile, Hungary has now been officially rejected (for the second time) by the European Monetary Union, such that its doubtful that Forint will ever be absorbed into the Euro.
Why, then, is the Forint rallying? The answer is simple: high interest rates. The benchmark Hungarian interest rate is a lofty 9.5%. While other Central Banks have been busy lowering rates to try to boost economic growth, “The Monetary Council of the central bank voted unanimously on April 20 to keep rates on hold at 9.50 percent.” Given the precarious financial situation, its economic policymakers are concerned that a drop in interest rates could precipitate capital flight and a currency crisis.
An exasperated Deputy Central Bank Governor explained to reporters, “As long as Hungary is considered such a vulnerable country, our interest rates cannot be lower than South Africa’s or Turkey’s; it’s not the Czech Republic, Slovakia or Poland you should compare us to.” She has clearly been paying monitoring the forex markets and knows that now is not the time to gamble with investors’ sudden return to Hungary.
Analysts remain divided over whether the upward trend in the Forint is sustainable. For its part, “Deutsche Bank recommends investors sell the euro against the forint on bets the rate difference will help the Hungarian currency gain 10 percent to 260 per euro in two to three months from 286.55 today.” However, it will be difficult for the economy to stage a serious economy for as long as the currency is rallying, which is why a survey of analysts revealed a median forecast of a medium-term decline in the Forint.
